Masticatory load: the force generated by your jaw muscles (masticatory muscles) when you chew food, effectively the pressure applied to oral tissues and teeth to break down food for swallowing
Industrial groups: Samples of people after food industrialization
Cariogenic: causing tooth decay
Background
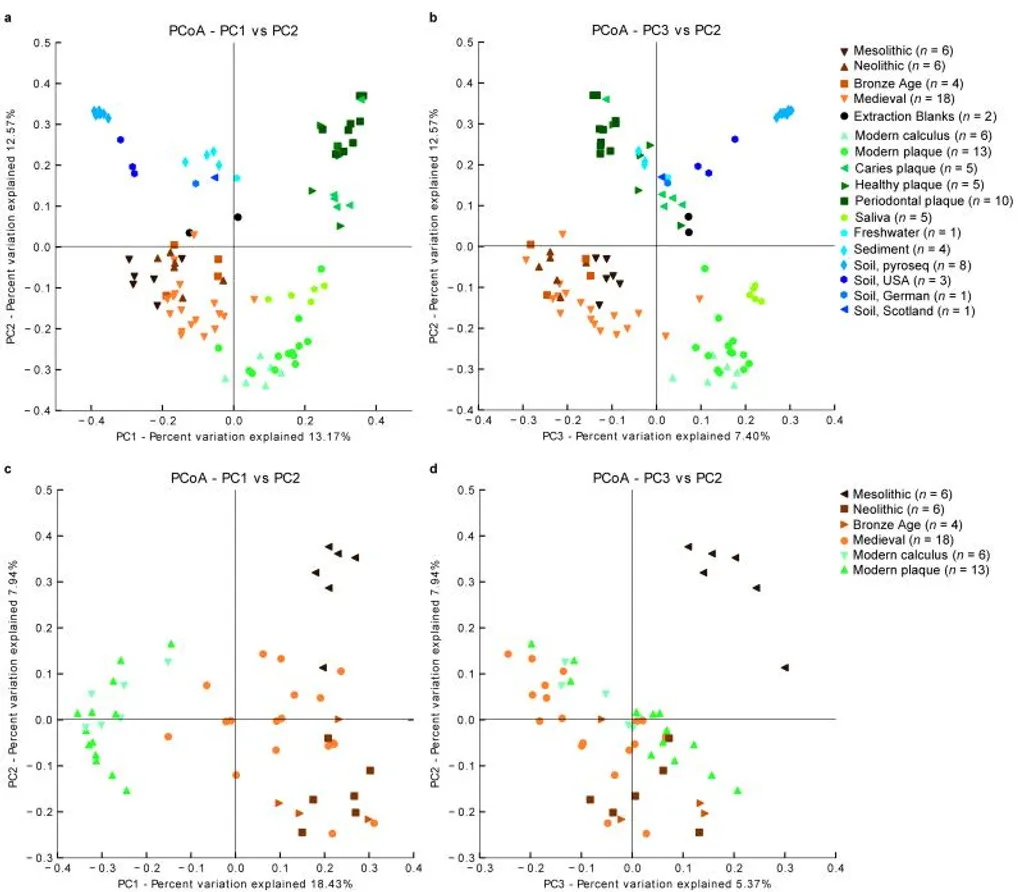
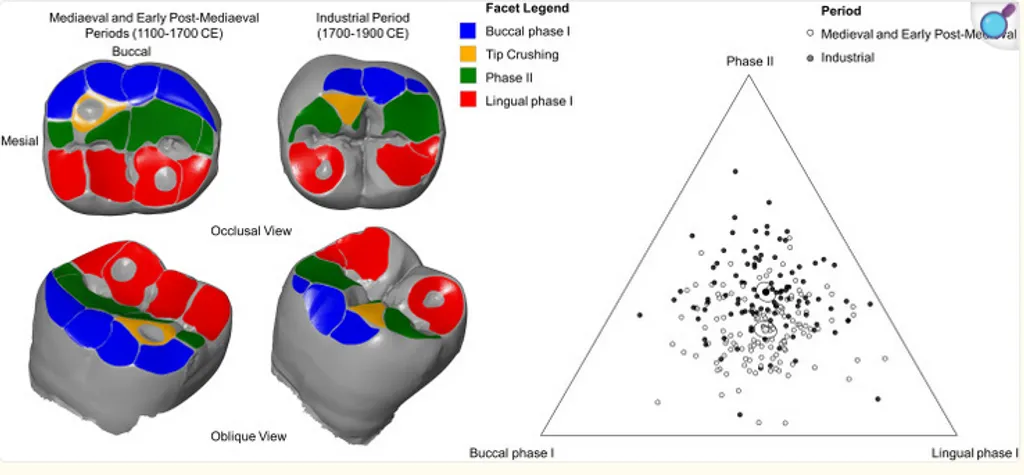
In recent years, many dental problems affect daily life. One reason is the modern diet because the foods are sweeter, more processed, and softer, so people chew less, especially during growth. With lower masticatory load, dental arches can develop narrower and there is less space for the back teeth. Figure 2 from Silvester et al. (2021) shows how industrial samples have a different wear pattern compared with pre-industrial groups, consistent with changed chewing behavior. A second result of the same shift appears in Figure 2 from Adler et al. (2013): ancient dental calculus and modern plaque form separate clusters, meaning the oral microbiota moved toward a more cariogenic profile as starch and sugar increased. Together, these figures explain how dietary change across generations shaped human dentition smaller arches and limited posterior space related to third molars, and a higher caries risk due to a more cariogenic biofilm (Silvester et al. 2021; Adler et al. 2013).
Figure 1. Principal components plot of β -diversity PCoA reveals a close phylogenetic relationship between ancient dental calculus and modern oral samples, both of which are distinct from the non-template controls and environmental samples. β -diversity was calculated for all samples (Supplementary Note) using the UniFrac metric for the V3 region, and PCoA was applied to the unweighted, UniFrac distances. The plot of the first and second components (PC1 and PC2) (a) and the first and third components (PC1 and PC3) (b) of the PCoA clustered the ancient dental calculus samples with the modern oral pyrosequenced data (calculus, plaque and saliva), which were separated from the environmental samples and extraction blanks. A restricted PCoA plot of PC1 and PC2 (c) and PC1 and PC3 (d) that only includes ancient and modern oral pyrosequencing samples separated the hunter-gatherer (Mesolithic) individuals from modern, Medieval, and Neolithic samples. (Adler et al. (2013))
Figure 2. Comparison of dental wear facet patterns between the pre-industrial and industrial groups. Above: Comparison of lower second molar dental wear facet patterns between the medieval and early post-medieval Periods and the industrial Period. Wear facets are marked as follows: buccal phase I facets are blue, lingual phase I facets are red, phase II facets are green and tip crushing areas are orange. Note large phase II wear facets in the industrial period relative to buccal phase I wear. In the earlier periods, lingual phase I wear facets and buccal phase I facets occupy a larger proportion of the overall wear facet area. Below: Ternary plot showing the relationship between period and relative wear facet area of the lower second molar (composed of buccal phase I (BPI), lingual phase I (LPI) and phase II (PII) facet areas). The industrial group is displayed as dark grey circles and the medieval and early post-medieval group as light grey circles. The centre value for each period is represented as a larger filled shape surrounded by 95% confidence regions. The industrial group is represented by a large black circle and the medieval group a white circle. (Silvester et al. (2021))